DatabaseComments Off on Install Memcached on CentOS 7
Sep072015
Free & open source, high-performance, distributed memory object caching system, generic in nature, but intended for use in speeding up dynamic web applications by alleviating database load.Memcached is an in-memory key-value store for small chunks of arbitrary data (strings, objects) from results of database calls, API calls, or page rendering.
Memcached is simple yet powerful. Its simple design promotes quick deployment, ease of development, and solves many problems facing large data caches. Its APIis available for most popular languages.
Here is the simple steps to install Memcached on CentOS 7.
Open Terminal and then switch to root user.
[raj@itzgeek~/]$ su -l
Install Memcached:
Install Memcached using the following command.
[root@itzgeek~/]# yum install memcached
Edit Memcached configuration file to change / enable the features.
[root@itzgeek~/]# vi /etc/sysconfig/memcached
There are some default settings available in the configuration file, change it (if necessary). The following is example settings for 256MB caching.
DatabaseComments Off on Manage PostgreSQL using phpPgAdmin on CentOS 7
Sep072015
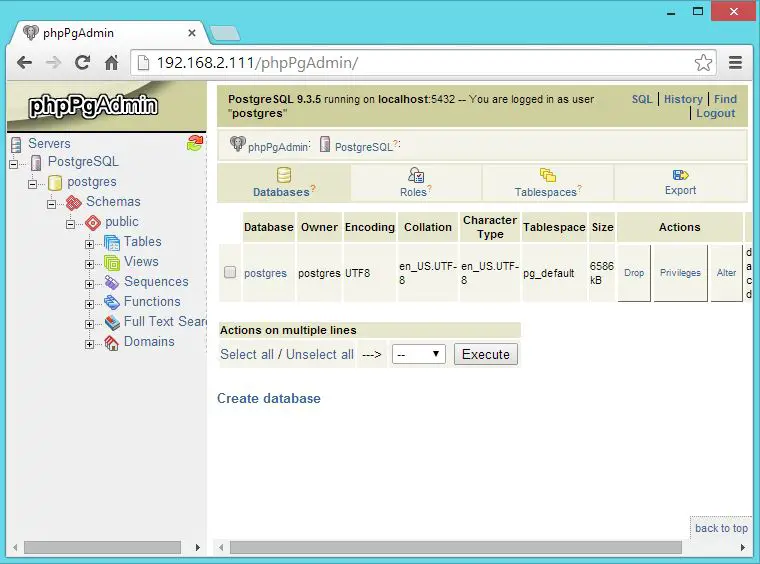
phpPgAdmin is a web based administration tool for managing PostgreSQL database, it is very similar in look of phpMyAdmin. If you have a work experience on phpMyAdmin, you wont take much time in finding the way to work with. This guide will help you to setup phpPgAdmin on CentOS 7 / RHEL 7.
Edit /etc/phpPgAdmin/config.inc.php file, we have to modify the admin file to enable the browser access.
vi /etc/phpPgAdmin/config.inc.php
Add the localhost in the following server parameter.
$conf['servers'][0]['host'] = 'localhost';
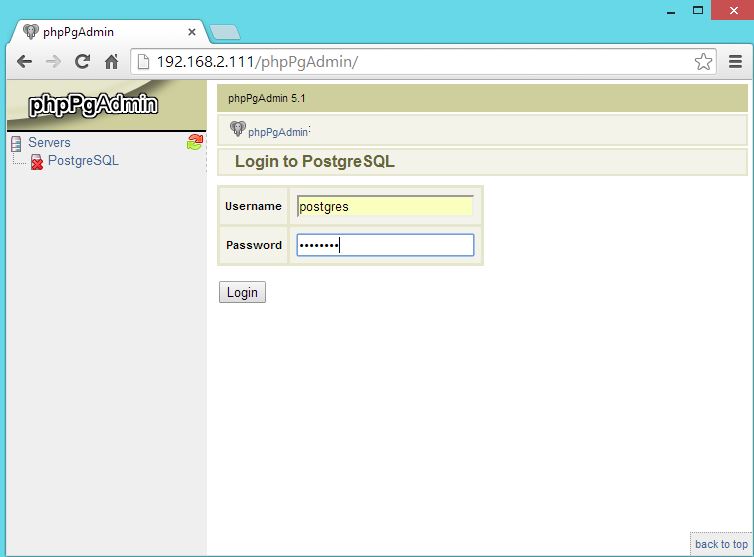
If extra login security is true, then logins via phpPgAdmin with no password or certain usernames (pgsql, postgres, root, administrator) will be denied. To enable the postgres login, change it to false.
$conf['extra_login_security'] = false;
To simply hide other databases in the list make following condition to true – this does not in any way prevent your users from seeing other database by other means.
$conf['owned_only'] = true;
Configuring PostgreSQL:
Modify config file to accept the authentication from the remote networks.
vi /var/lib/pgsql/9.3/data/pg_hba.conf
Please enter the value as per your requirements inIPv4 and Ipv6 connections and make sure it accepts md5 passwords.
# IPv4 local connections:
host    all             all             127.0.0.1/32            md5
host    all             all             192.168.2.0/24         md5
# IPv6 local connections:
host    all             all             ::1/128                 md5
Configuring Apche:
By-default phpPgAdmin places the web config file in /etc/httpd/conf.d directory; it has the rules and access permission for the web access. In CentOS 7, web access is managed by mod_authz_core.cmodule; so normal allow or deny rules wont work even if you modify.
vi /etc/httpd/conf.d/phpPgAdmin.conf
Default config will look like below.
Alias /phpPgAdmin /usr/share/phpPgAdmin
<Location /phpPgAdmin>
<IfModule mod_authz_core.c>
# Apache 2.4
Require local
#Require host example.com
</IfModule>
<IfModule !mod_authz_core.c>
# Apache 2.2
Order deny,allow
Deny from all
Allow from 127.0.0.1
Allow from ::1
# Allow from .example.com
</IfModule>
</Location>
Please comment Require local and add Require all granted just below to commented line, it will look like below.
Alias /phpPgAdmin /usr/share/phpPgAdmin
<Location /phpPgAdmin>
<IfModule mod_authz_core.c>
# Apache 2.4 # Require local Require all granted
#Require host example.com
</IfModule>
<IfModule !mod_authz_core.c>
# Apache 2.2
Order deny,allow
Deny from all
Allow from 127.0.0.1
Allow from ::1
# Allow from .example.com
</IfModule>
</Location>
PentestComments Off on Install OpenVAS on CentOS 7 / RHEL 7
Sep072015
OpenVAS known as Open Vulnerability Assessment System is the open source vulnerability suite to run the test against servers for known vulnerabilities using the database (Network Vulnerability Tests), OpenVAS is a free software, its components are licensed under GNU General Public License (GNU GPL). Here is the small guide to setup the OpenVAS on CentOS 7 / RHEL 7.
Setup Repository:
Issue the following command in the terminal to install atomic repo.
Atomic Free Unsupported Archive installer, version 2.0.12BY INSTALLING THIS SOFTWARE AND BY USING ANY AND ALL SOFTWARE
PROVIDED BY ATOMICORP LIMITED YOU ACKNOWLEDGE AND AGREE:THIS SOFTWARE AND ALL SOFTWARE PROVIDED IN THIS REPOSITORY IS
PROVIDED BY ATOMICORP LIMITED AS IS, IS UNSUPPORTED AND ANY
EXPRESS OR IMPLIED WARRANTIES, INCLUDING, BUT NOT LIMITED TO, THE
IMPLIED WARRANTIES OF MERCHANTABILITY AND FITNESS FOR A PARTICULAR
PURPOSE ARE DISCLAIMED. IN NO EVENT SHALL ATOMICORP LIMITED, THE
COPYRIGHT OWNER OR ANY CONTRIBUTOR TO ANY AND ALL SOFTWARE PROVIDED
BY OR PUBLISHED IN THIS REPOSITORY BE LIABLE FOR ANY DIRECT,
INDIRECT, INCIDENTAL, SPECIAL, EXEMPLARY, OR CONSEQUENTIAL DAMAGES
(INCLUDING, BUT NOT LIMITED TO, PROCUREMENT OF SUBSTITUTE GOODS
OR SERVICES; LOSS OF USE, DATA, OR PROFITS; OR BUSINESS INTERRUPTION)
HOWEVER CAUSED AND ON ANY THEORY OF LIABILITY, WHETHER IN CONTRACT,
STRICT LIABILITY, OR TORT (INCLUDING NEGLIGENCE OR OTHERWISE)
ARISING IN ANY WAY OUT OF THE USE OF THIS SOFTWARE, EVEN IF ADVISED
OF THE POSSIBILITY OF SUCH DAMAGE.====================================================================
THIS SOFTWARE IS UNSUPPORTED. IF YOU REQUIRE SUPPORTED SOFWARE
PLEASE SEE THE URL BELOW TO PURCHASE A NUCLEUS LICENSE AND DO NOT
PROCEED WITH INSTALLING THIS PACKAGE.
====================================================================For supported software packages please purchase a Nucleus license:
https://www.atomicorp.com/products/nucleus.html
All atomic repository rpms are UNSUPPORTED.
Do you agree to these terms? (yes/no) [Default: yes] yesConfiguring the [atomic] yum archive for this systemInstalling the Atomic GPG key: OK
Downloading atomic-release-1.0-19.el7.art.noarch.rpm: OKThe Atomic Rocket Turtle archive has now been installed and configured for your system
The following channels are available:
atomic – [ACTIVATED] – contains the stable tree of ART packages
atomic-testing – [DISABLED] – contains the testing tree of ART packages
atomic-bleeding – [DISABLED] – contains the development tree of ART packages
System Repo (Only for RHEL):
OpenVAS installation requires additional packages to be downloaded from internet, if your system does not have Redhat subscription you need to setup the CentOS repository.
PS: CentOS machines do not requires the above repo setup, system automatically creates it during the installation.
Install & Setup OpenVAS:
Issue the following command to install OpenVAS.
# yum -y install openvas
It will do the package installation.
 texlive-tipa                                     noarch                     2:svn29349.1.3-32.el7                                    base                        2.8 M
 texlive-tools                                    noarch                     2:svn26263.0-32.el7                                      base                         61 k
 texlive-underscore                               noarch                     2:svn18261.0-32.el7                                      base                         21 k
 texlive-unicode-math                             noarch                     2:svn29413.0.7d-32.el7                                   base                         60 k
 texlive-url                                      noarch                     2:svn16864.3.2-32.el7                                    base                         25 k
 texlive-varwidth                                 noarch                     2:svn24104.0.92-32.el7                                   base                         20 k
 texlive-xcolor                                   noarch                     2:svn15878.2.11-32.el7                                   base                         34 k
 texlive-xkeyval                                  noarch                     2:svn27995.2.6a-32.el7                                   base                         26 k
 texlive-xunicode                                 noarch                     2:svn23897.0.981-32.el7                                  base                         43 k
 unzip                                            x86_64                     6.0-13.el7                                               base                        165 k
 wapiti                                           noarch                     2.3.0-5.el7.art                                          atomic                      290 k
 which                                            x86_64                     2.20-7.el7                                               base                         41 k
 wmi                                              x86_64                     1.3.14-4.el7.art                                         atomic                      7.7 M
 zip                                              x86_64                     3.0-10.el7                                               base                        260 k
 zziplib                                          x86_64                     0.13.62-5.el7                                            base                         81 k

Transaction Summary
========================================================================================================================================================================
Install  1 Package (+262 Dependent packages)

Total download size: 84 M
Installed size: 280 M
Is this ok [y/d/N]: y
(1/263): bzip2-1.0.6-12.el7.x86_64.rpm                                                                                                           |  52 kB  00:00:00
warning: /var/cache/yum/x86_64/7/atomic/packages/alien-8.90-2.el7.art.noarch.rpm: Header V3 RSA/SHA1 Signature, key ID 4520afa9: NOKEY
Public key for alien-8.90-2.el7.art.noarch.rpm is not installed
(2/263): alien-8.90-2.el7.art.noarch.rpm                                                                                                         |  90 kB  00:00:00
(3/263): automake-1.13.4-3.el7.noarch.rpm                                                                                                        | 679 kB  00:00:00
(4/263): autoconf-2.69-11.el7.noarch.rpm                                                                                                         | 701 kB  00:00:00
(5/263): debconf-1.5.52-2.el7.art.noarch.rpm                                                                                                     | 186 kB  00:00:00
(6/263): dirb-221-2.el7.art.x86_64.rpm                                                                                                           |  46 kB  00:00:00
(7/263): dpkg-perl-1.16.15-1.el7.art.noarch.rpm                                                                                                  | 292 kB  00:00:00
(8/263): debhelper-9.20140228-1.el7.art.noarch.rpm                                                                                               | 750 kB  00:00:00
(9/263): doxygen-1.8.5-3.el7.x86_64.rpm                                                                                                          | 3.6 MB  00:00:00
(10/263): dpkg-1.16.15-1.el7.art.x86_64.rpm                                                                                                      | 1.2 MB  00:00:00
 texlive-tetex-bin.noarch 2:svn27344.0-32.20130427_r30134.el7                       texlive-thumbpdf.noarch 2:svn26689.3.15-32.el7
 texlive-thumbpdf-bin.noarch 2:svn6898.0-32.20130427_r30134.el7                     texlive-tipa.noarch 2:svn29349.1.3-32.el7
 texlive-tools.noarch 2:svn26263.0-32.el7                                           texlive-underscore.noarch 2:svn18261.0-32.el7
 texlive-unicode-math.noarch 2:svn29413.0.7d-32.el7                                 texlive-url.noarch 2:svn16864.3.2-32.el7
 texlive-varwidth.noarch 2:svn24104.0.92-32.el7                                     texlive-xcolor.noarch 2:svn15878.2.11-32.el7
 texlive-xkeyval.noarch 2:svn27995.2.6a-32.el7                                      texlive-xunicode.noarch 2:svn23897.0.981-32.el7
 unzip.x86_64 0:6.0-13.el7                                                          wapiti.noarch 0:2.3.0-5.el7.art
 which.x86_64 0:2.20-7.el7                                                          wmi.x86_64 0:1.3.14-4.el7.art
 zip.x86_64 0:3.0-10.el7                                                            zziplib.x86_64 0:0.13.62-5.el7

 Complete!
Once the installation is completed, start the OpenVAS setup.
# openvas-setup
Setup will start to download the latest database from internet, Upon completion, setup would ask you to configure listening ip address.
Step 2: Configure GSAD
The Greenbone Security Assistant is a Web Based front end
for managing scans. By default it is configured to only allow
connections from localhost.
Allow connections from any IP? [Default: yes]
Restarting gsad (via systemctl):                           [  OK  ]
Configure admin user.
Step 3: Choose the GSAD admin users password.
The admin user is used to configure accounts,
Update NVT's manually, and manage roles.
Enter administrator username [Default: admin] : admin
Enter Administrator Password:
Verify Administrator Password:
Once completed, you would see the following message.
Setup complete, you can now access GSAD at:
https://<IP>:9392
Disable Iptables.
# systemctl stop iptables.service
Create Certificate for OpenVAS manager.
# openvas-mkcert-client -n om -i
You do not require to enter any information, it will automatically creates for you.
Generating RSA private key, 1024 bit long modulus
…………………..++++++
………………………..++++++
e is 65537 (0x10001)
You are about to be asked to enter information that will be incorporated
into your certificate request.
What you are about to enter is what is called a Distinguished Name or a DN.
There are quite a few fields but you can leave some blank
For some fields there will be a default value,
If you enter ‘.’, the field will be left blank.
—–
Country Name (2 letter code) [DE]:State or Province Name (full name) [Some-State]:Locality Name (eg, city) []:Organization Name (eg, company) [Internet Widgits Pty Ltd]:Organizational Unit Name (eg, section) []:Common Name (eg, your name or your server’s hostname) []:Email Address []:Using configuration from /tmp/openvas-mkcert-client.2827/stdC.cnf
Check that the request matches the signature
Signature ok
The Subject’s Distinguished Name is as follows
countryName :PRINTABLE:’DE’
localityName :PRINTABLE:’Berlin’
commonName :PRINTABLE:’om’
Certificate is to be certified until Aug 5 19:43:32 2015 GMT (365 days)Write out database with 1 new entries
Data Base Updated
Your client certificates are in /tmp/openvas-mkcert-client.2827 .You will have to copy them by hand.
Now Rebuild the OpenVAS database (If required)
# openvasmd --rebuild
Once Completed, Start the OpenVAS manager.
# openvasmd
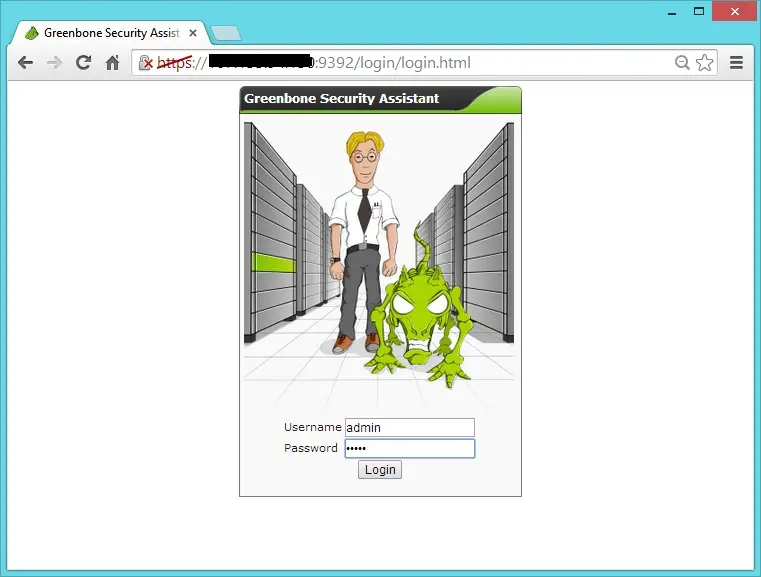
Open your browser and point to https://your-ip-address:9392. Login as admin using the password created by you.
CentOS 7 – OpenVAS Login
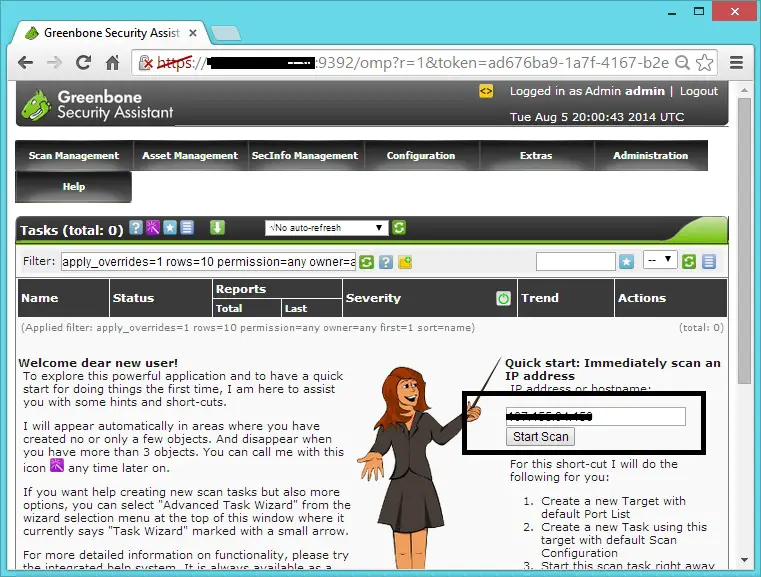
You can start the quick scan by entering ip address in the quick scan field.
CentOS 7 – Scan Machine
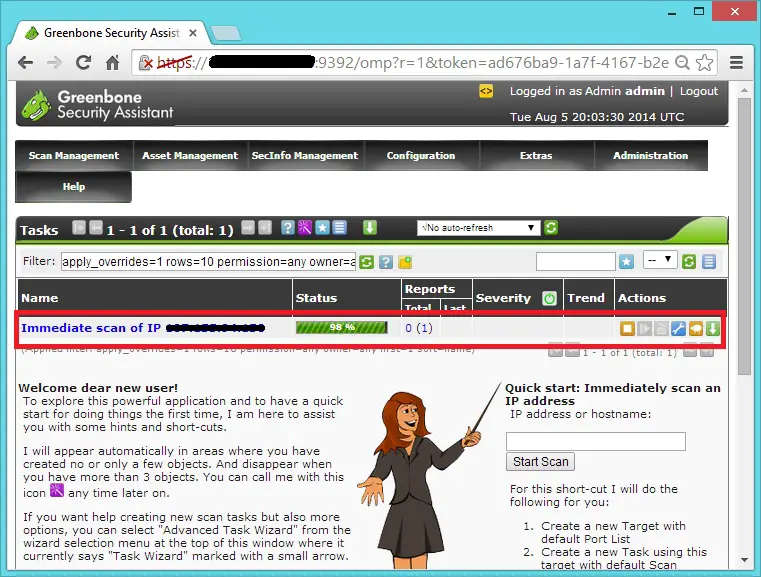
After that you would the see immediate task like below. currently 98% scanning is completed
CentOS 7 – Scanning Status
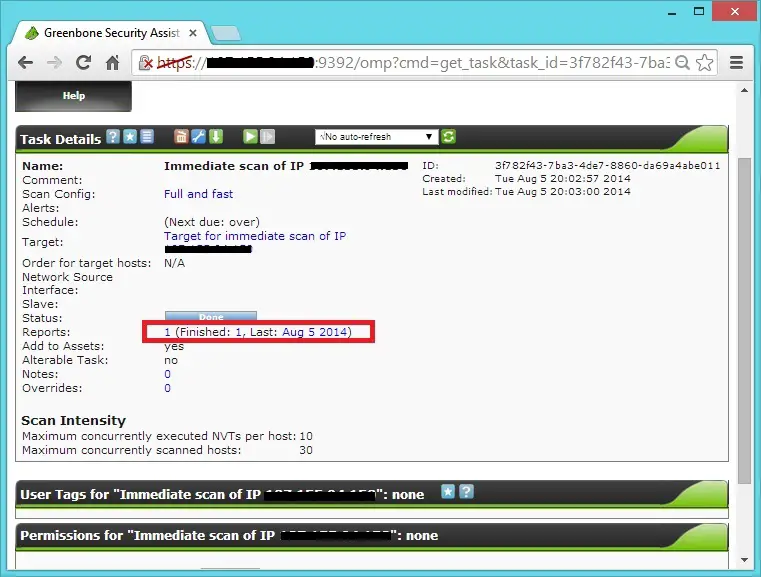
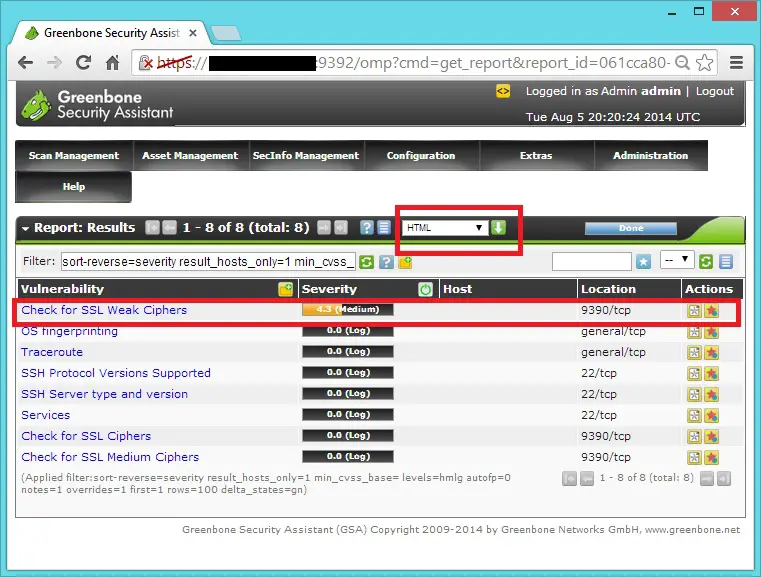
Click on the task to view the details of the scan, details will be like below. Once the scan is completed, click on “Date” to see the report.
CentOS 7 – VA Scanning Completed
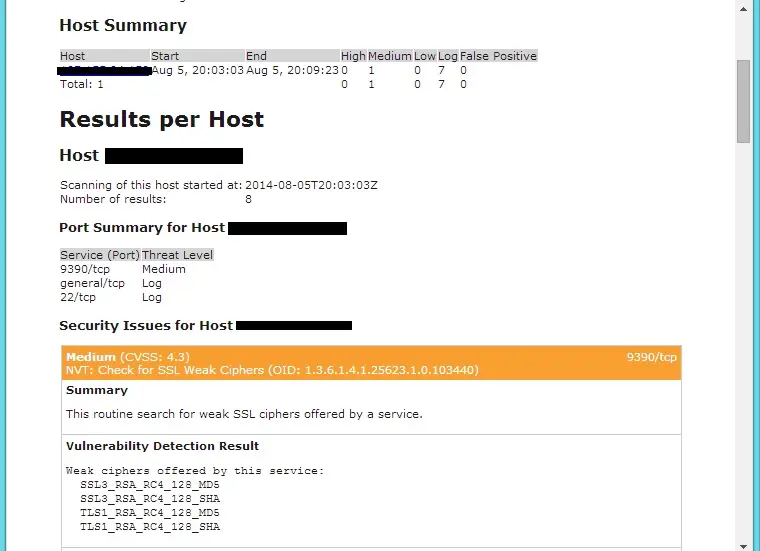
In report page you have option to download the report in multiple format like pdf, html,xml, etc,.. or you can click on the each Vulnerability to see the full information.
MonitoringComments Off on Monitor remote machine with Icinga on CentOS 7
Sep072015
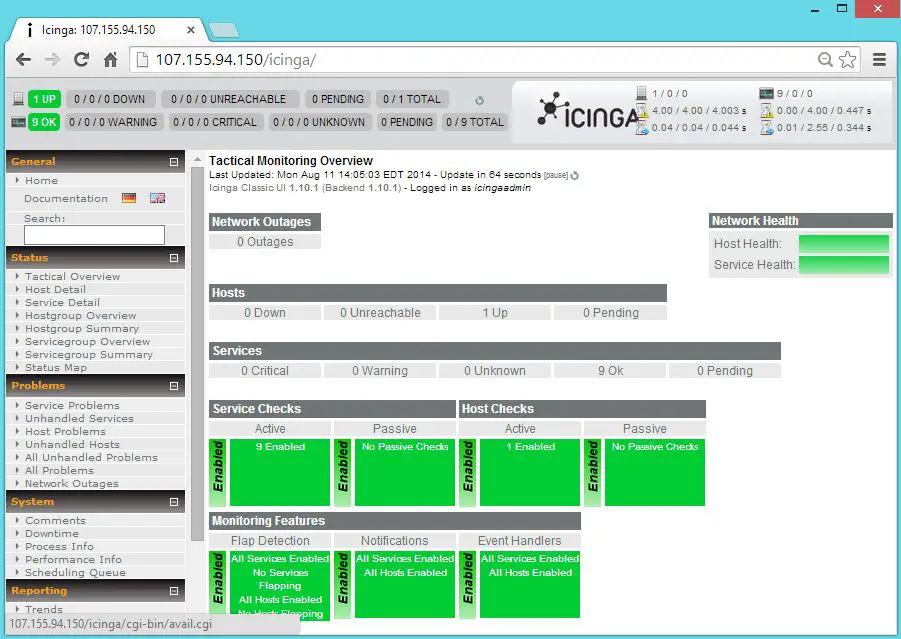
Once you installed the Icinga, you can monitor the system via web interface; by default it is limited to monitor the local machine where Icinga installed. If you like to monitor the remote Linux box or Windows box, you need to have Nagios plugin and NRPE add-on installed on the remote box. Once installed the plugin and add-on, you need to configure the Icinga server to collect the information from the remote machine and display it on the web interface.
If you are yet to install the Icinga; visit the post of Installing Icinga on Centos 7. Monitoring the Remote Linux system includes the 6 Steps
cd /tmp
wget http://downloads.sourceforge.net/project/nagios/nrpe-2.x/nrpe-2.15/nrpe-2.15.tar.gz
Once downloaded, Extract the tar ball.
tar -zxvf /tmp/nrpe-2.15.tar.gz
cd /tmp/nrpe-2.15
Compile it.
./configure --with-nagios-user=icinga --with-nagios-group=icinga --with-nrpe-group=icinga --with-nrpe-user=icinga --prefix=/usr/local/icinga
make all
make install-plugin
make install-daemon
make install-daemon-config
make install-xinetd
Configure NRPE Add-on:
NRPE is the part of the xinetd daemon, modify the NRPE configurations file to accept the connection from the Nagios server, Edit the /etc/xinetd.d/nrpe.
vi /etc/xinetd.d/nrpe
Add the Nagios server ip address like below.
only_from = 127.0.0.1 192.168.12.151
Add NRPE port at the end of the /etc/services file.
Modify the /usr/local/icinga/etc/nrpe.cfg on the remote host, it contains the command argument to check the service on the remote host. The nrpe.cfg file contains the basic commands to check the remote services, below are the command lines to check the cpu load and running process. Thecheck_load and check_total_procs has to be entered on template file on the server host to enable the monitoring.
In the above command -w stands for warning whereas -c stands for critical alert. For example if you execute the second command on the terminal, it will check the running process; it will warn when the process more than 150 or it will report critical when the process more than 200 and at the same time it will say OK if process below 150.
Change warning to 15 and critical to 150 for testing purpose, since process running on the server is very less. Now you can see the warning message, according to your requirement you can modify it.
cd /tmp
wget http://downloads.sourceforge.net/project/nagios/nrpe-2.x/nrpe-2.15/nrpe-2.15.tar.gz
Once downloaded, Extract the tar ball.
tar -zxvf /tmp/nrpe-2.15.tar.gz
cd /tmp/nrpe-2.15
Compile it.
./configure --with-nagios-user=icinga --with-nagios-group=icinga --with-nrpe-group=icinga --with-nrpe-user=icinga --prefix=/usr/local/icinga
make all
make install-plugin
Configure Nagios Server:
Now its the time configure the Icinga server to monitor the remote client, You’ll need to create a command definition in one of your Icinga object configuration files in order to use the check_nrpe plugin. Edit commands.cfg file.
Create the new configuration file (/usr/local/icinga/etc/objects/remote.cfg) to define the host and service definition. You can use the following template, modify according to your requirement. The following is configured to display the CPU Load,Disk Space,Current Users. Etc..,
define host{
use linux-server
host_name remote.itzgeek.com
alias Client 1
address 192.168.12.102
}
define hostgroup{
hostgroup_name Linux Client
alias Linux Client 1
members remote.itzgeek.com
}
define service{
use local-service
host_name remote.itzgeek.com
service_description Root Partition
check_command check_nrpe!check_hda1
}
define service{
use local-service
host_name remote.itzgeek.com
service_description Current Users
check_command check_nrpe!check_users
}
define service{
use local-service
host_name remote.itzgeek.com
service_description Total Processes
check_command check_nrpe!check_total_procs
}
define service{
use local-service
host_name remote.itzgeek.com
service_description Current Load
check_command check_nrpe!check_load
}
Add the new template on the icinga.cfg configuration file, so that it will read the new entries.
vi /usr/local/icinga/etc/icinga.cfg
Add below line.
# Definitions for monitoring the Remote (Linux) host
cfg_file=/usr/local/icinga/etc/objects/remote.cfg
Restart the icinga server.
/etc/init.d/icinga restart
Monitor the remote machine:
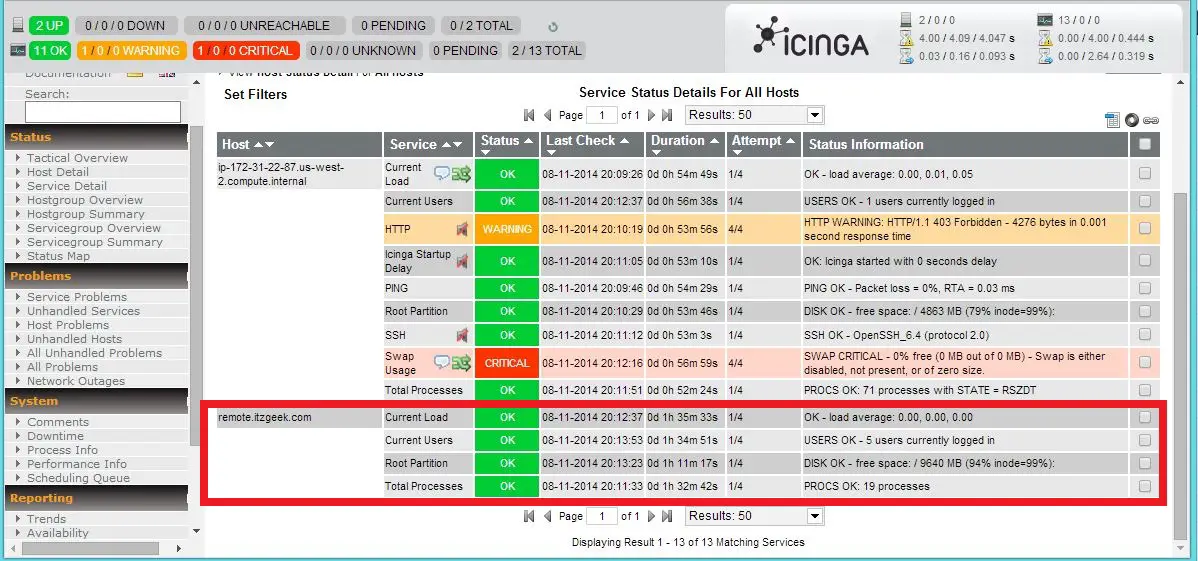
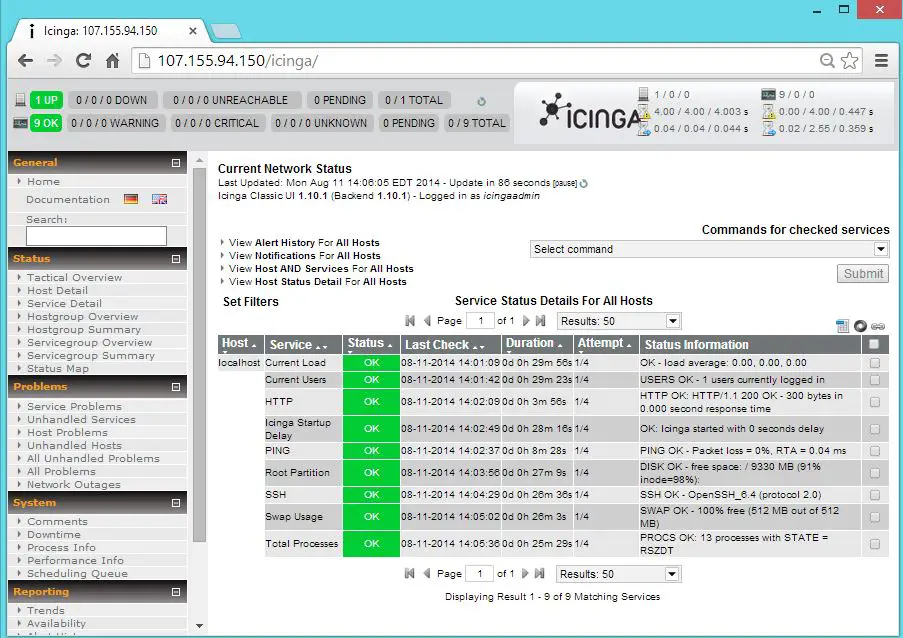
Now login to the web interface and start do the monitoring. The following screenshot shows the remote Linux server with the default service available.
CentOS 7 – Icinga With Remote Monitoring
That’s All. Now you can easily monitor the remote machine with Icinga.
MonitoringComments Off on Setup Icinga Monitoring Tool on CentOS 7 / RHEL 7
Sep072015
Icinga is a fork of famous Ngaios monitoring tool, it is very compatible with Nagios and can be integrated with Nagios plugins. Icinga is very similar to Nagios, so you wont find any difficult in moving to Icinga. Icinga is one step ahead on multiple factors, the import factor is advanced reporting using we based jasper reports, the most improved web interface and its comes as virtual appliance.
sed -i 's/SELINUX=enforcing/SELINUX=disabled/g' /etc/selinux/config
Reboot once done.
Create icinga user and icinga-cmd group (allowing the external commands to be executed through the web interface) , add icinga and apache user to the part of icinga-cmd group.
# useradd icinga
# groupadd icinga-cmd
# usermod -a -G icinga-cmd icinga
# usermod -a -G icinga-cmd apache
Download latest Icinga source tarball.
# cd /tmp/
# wget http://downloads.sourceforge.net/project/icinga/icinga/1.10.1/icinga-1.10.1.tar.gz
# tar -zxvf /tmp/icinga-1.10.1.tar.gz
# cd /tmp/icinga-1.10.1
Compile and Install Icinga:
# ./configure --with-command-group=icinga-cmd --enable-idoutils
# make all
# make install
# make install-init
# make install-config
# make install-commandmode
# make install-webconf
# make install-idoutils
Configure Icinga:
Sample configuration files have now been installed in the /usr/local/icinga/etc/ directory. These sample files should work fine for getting started with Icinga. You’ll need to make just one change before you proceed. Edit the /usr/local/icinga/etc/objects/contacts.cfg config file with your favorite editor and change the email address associated with the nagiosadmin contact definition to the address you’d like to use for receiving alerts.
# vi /usr/local/icinga/etc/objects/contacts.cfg
Change the Email address field to receive the notification.
Restart Apache to make the new settings take effect.
systemctl restart httpd.service
Download and Install Nagios Plugins:
Download Nagios Plugins to /tmp directory.
# cd /tmp
# wget http://nagios-plugins.org/download/nagios-plugins-2.0.3.tar.gz
# tar -zxvf /tmp/nagios-plugins-2.0.3.tar.gz
# cd /tmp/nagios-plugins-2.0.3/
Compile and install the plugins.
# ./configure --prefix=/usr/local/icinga --with-cgiurl=/icinga/cgi-bin --with-nagios-user=icinga --with-nagios-group=icinga
# make
# make install
LinuxComments Off on Install Jetty web server on CentOS 7 / RHEL 7
Sep072015
Jetty web server is a java based http server and servlet container, web servers are normally used for serving static content to client, nowadays jetty is used for server to server communication, within large frameworks. Jetty is developed under open source license,part of Eclipse foundation, it is used in multiple active products such as Apache ActiveMQ,Alfresco, Apache Geronimo,Apache Maven, Apache Spark and also in open source project such as Hadoop, Eucalyptus and Red5.
Jetty supports the latest Java Servlet API as well as protocols SPDY and WebSocket, this guide will help you to set up jetty on CentOS 7 / RHEL 7.
LinuxComments Off on How to install Graylog2 on CentOS 7 / RHEL 7
Sep072015
Graylog
Graylog (formerly known as Graylog2) is an open source log management platform, helps you to collect, index and analyze any machine logs on a centralized location. This guide helps you to install Graylog2 on CentOS 7 / RHEL 7, also focus on installation of four other components that makes Graylog2 a power full log management tool.
1. MongoDB – Stores the configurations and meta information.
2. Elasticsearch – Stores the log messages and offers a searching facility, nodes should have high memory as all the I/O operations are happens here.
3. GrayLog – Log parser, it collect the logs from various inputs.
4. GrayLog Web interface = provides you the web-based portal for managing the logs.
Pre-requisites:
1. Since the Elasticsearch is based on java, we would require to install either openJDK or Oracle JDK. It is recommended to install Oracle JDK, verify the java version by using the following command.
# java -version

java version "1.8.0_11"
Java(TM) SE Runtime Environment (build 1.8.0_11-b12)
Java HotSpot(TM) 64-Bit Server VM (build 25.11-b03, mixed mode)
Elasticsearch is an open source search server, it offers a realtime distributed search and analytics with RESTful web interface. Elasticsearch stores all the logs sent by the Graylog server and displays the messages when the graylog web interface requests for full filling user request over the web interface. This topic covers configuration settings that is required for Graylog, you can also take a look on Install Elasticsearch on CentOS 7 / Ubuntu 14.10 / Linux Mint 17.1 for detailed instruction.
Let’s install the Elasticsearch, it can be downloaded from official website. You can use the following command to download via terminal and install it.
The only important thing is to set a cluster name as “graylog2“, that is being used by graylog. Now edit the configuration file of Elasticsearch.
# vi /etc/elasticsearch/elasticsearch.yml

cluster.name: graylog2
Disable dynamic scripts to avoid remote execution, that can be done by adding the following line at the end of above file.
script.disable_dynamic: true
Once it is done, we are good to go. Before that, restart the Elasticsearch services to load the modified configuration.
# systemctl restart elasticsearch.service
Wait for at least a minute to let the Elasticsearch get fully restarted, otherwise testing will fail. Elastisearch should be now listen on 9200 for processing HTTP request, we can use CURL to get the response. Ensure that it returns with cluster name as “graylog2”
MongoDB is available in RPM format and same can be downloaded from the official website. Add the following repository information on the system to install MongoDB using yum.
# vi /etc/yum.repos.d/mongodb-org-3.0.repo

[mongodb-org-3.0]
name=MongoDB Repository
baseurl=http://repo.mongodb.org/yum/redhat/$releasever/mongodb-org/3.0/x86_64/
gpgcheck=0
enabled=1
Install MongoDB using the following command.
# yum install -y mongodb-org
Run the following command to configure SELinux to allow MongoDB to start.
Start the MongoDB service and enable it to start automatically during the system start-up.
# service mongod start

# chkconfig mongod on
Th above steps are enough for configuring graylog2, you can find the detailed configuration here.
Install Graylog2:
Graylog-server accepts and process the log messages, also spawns the RESTAPI for the requests that comes from graylog-web-interface. Download the latest version of graylog from graylog.org, use the following command to download using terminal.
Next is to set a hash password for the root user (not to be confused with system user, root user of graylog is admin). You will use this password for login into the web interface, admin’s password can not be changed using web interface, must edit this variable to set.
Graylog will try to find the Elasticsearch nodes automatically, it uses multicast mode for the same. But when it comes to larger network, it is recommended to use unicast mode which is best suited one for production setups. So add the following two entries to graylog server.conf file, replace ipaddress with live hostname or ipaddress, multiple hosts can be added with comma separated.
Set only one master node by defining the below variable, default setting is true, you must set it as a false to make the particular node as a slave. Master node performs some periodic tasks that slave won’t perform.
is_master = true
The following variable sets the number of log messages to keep per index, it is recommended to have several smaller indices instead of larger ones.
elasticsearch_max_docs_per_index = 20000000
The following parameter defines to have total number of indices, if the this number is reached old index will be deleted.
elasticsearch_max_number_of_indices = 20
Shards setting is really depends on the number of nodes in the Elasticsearch cluster, if you have only one node, set it as 1.
elasticsearch_shards = 1
The number of replicas for your indices, if you have only one node in Elasticsearch cluster; set it as 0.
elasticsearch_replicas = 0
Enter your MongoDB authentication information.
# MongoDB Configuration
mongodb_useauth = false  #If this is set to false, you do not need to enter the authentication information
#mongodb_user = grayloguser
#mongodb_password = 123
mongodb_host = 127.0.0.1
#mongodb_replica_set = localhost:27017,localhost:27018,localhost:27019
mongodb_database = graylog2
mongodb_port = 27017
Start the graylog server using the following command.
# /opt/graylog/bin/graylogctl start
You can check out the server startup logs, it will be useful for you to troubleshoot the graylog in case of any issue.
# tailf /opt/graylog/log/graylog-server.log
On successful start of graylog-server, you should get the following message in the log file.
2015-03-23 16:28:15,825 INFO : org.graylog2.shared.initializers.RestApiService - Started REST API at <http://127.0.0.1:12900/>
To configure graylog-web-interface, you must have at least one graylog-server node; download the same version number to make sure that it is compatible
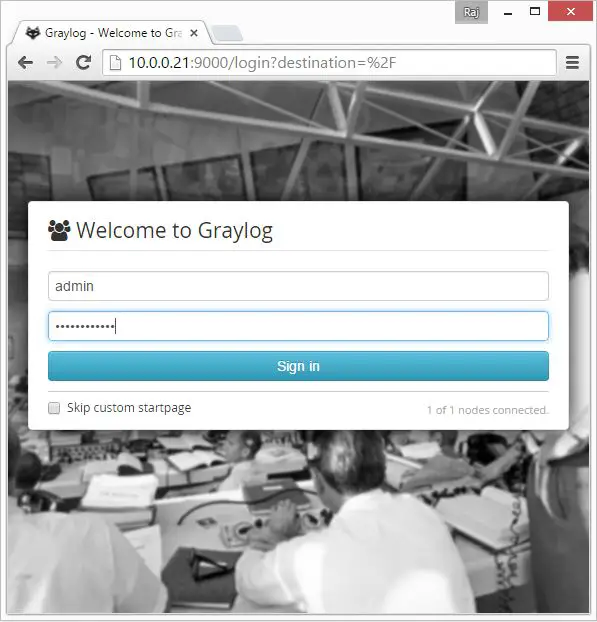
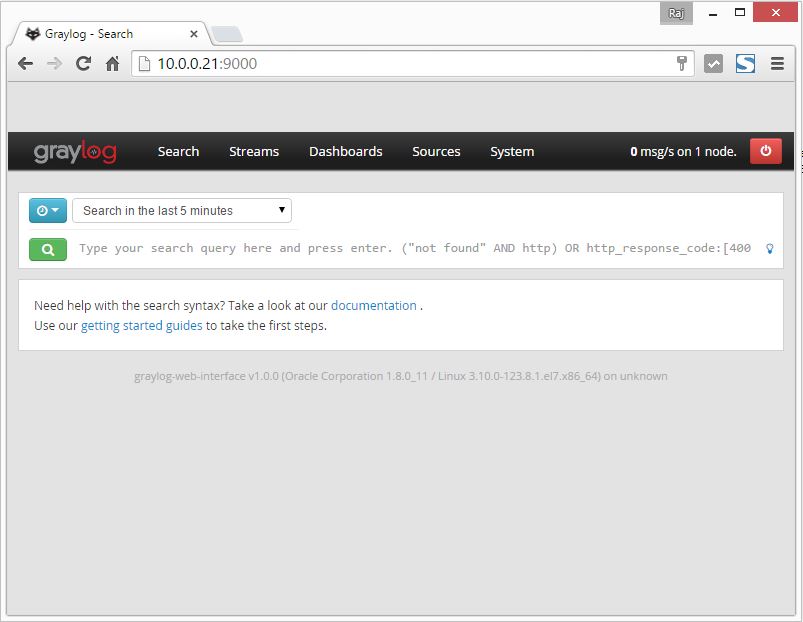
The web interface will listen on port 9000. Point your browser to it. Log in with username admin and the password you configured at root_password_sha2 on server.conf.
Configure the firewall to allow traffic on port 9000.
LinuxComments Off on Install Apache Hadoop on Ubuntu 14.10 / CentOS 7 (Single Node Cluster)
Sep072015
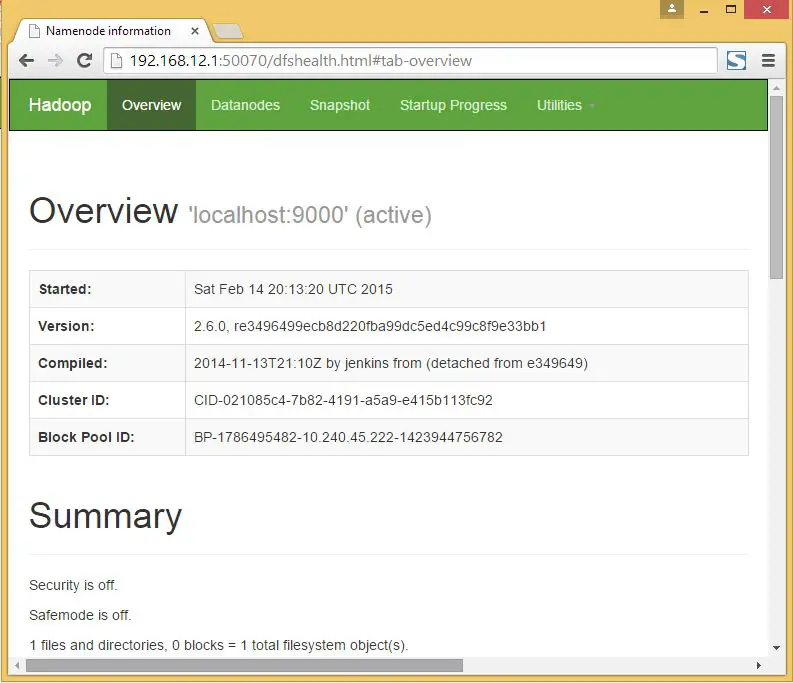
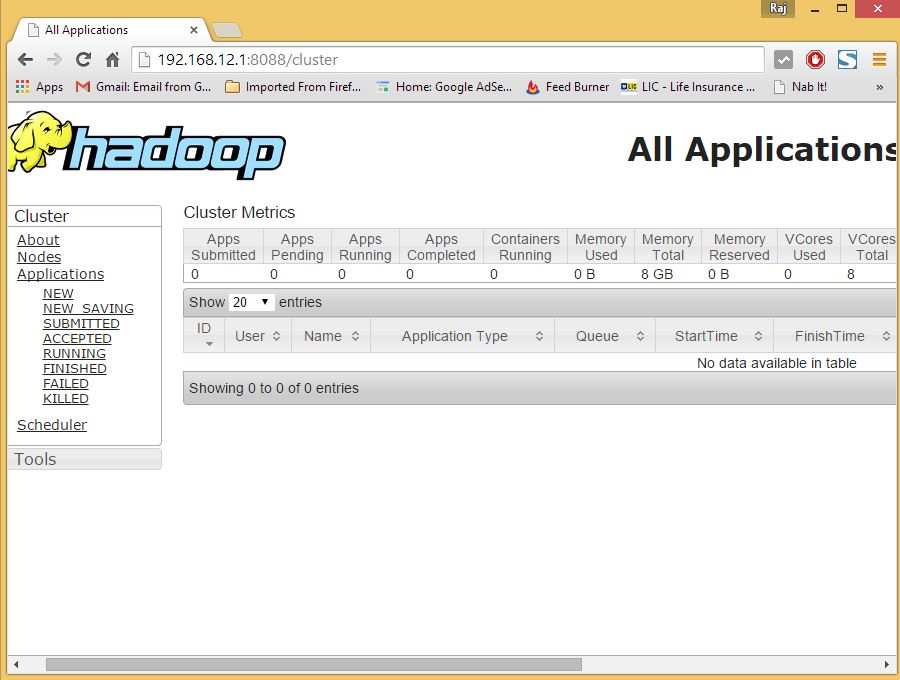
Hadoop
Apache Hadoop is a an open-source software framework written in Java for distributed storage and distributed process, it handles very large size of data sets by distributing it across computer clusters. Rather than rely on hardware high availability, hadoop modules are designed to detect and handle the failure at application layer, so gives you high-available serveice.
Hodoop framework consists of following modules,
Hadoop Common – It contains common set of libraries and utilities that support other Hadoop modules
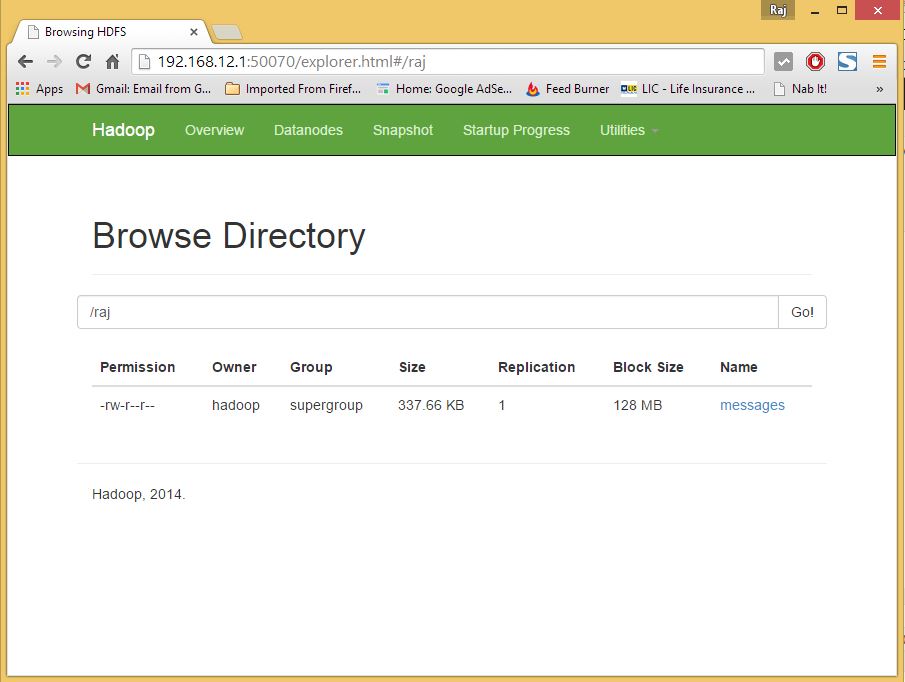
Hadoop Distributed File System (HDFS) – is a java based distributed file-system that stores data, providing very high-throughput to the application.
Hadoop YARN – It manages resources on compute clusters and using them for scheduling user’s applications.
Hadoop MapReduce – is a framework for large-scale data processing.
This guide will help you to get apache hadoop installed on Ubuntu 14.10 / CentOS 7.
Prerequisites:
Since hadoop is based on java, make sure you have java jdk installed on the system. Incase your machine don’t have a java, follow the below steps. You may also skip this if you have it already installed.
Download oracle java by using the following command, on assumption of 64 bit operating system.
VirtualizationComments Off on OpenStack Kilo on Ubuntu 14.04.2 – Configure Swift #1
Sep072015
The Swift AKA OpenStack Object Storage is a multi-tenant object storage system, provides a distributed scale-out object store across storage nodes that are in the cluster. This guide helps you to configure swift on Ubuntu 14.04.2.
There are two main components in Swift:
Swift proxy:
It accepts API and raw http requests to upload files, modify metadata, and create containers. Since the requests are done through REST API, it uses HTTP verbs with simple commands such as PUT and GET. When the user sends a data to be written, request will be go to proxy server and it will choose perfect storage node to store the data. You can have a multiple proxy servers for performance and redundancy. In our case, we will use controller node as a swift proxy server.
Storage node:
This is where the user data gets stored, you can have multiple storage nodes in your environment. Swift is a replicated based system, all the data stored inside of it will be stored at multiple times (replicas) to ensure high availability of data.
Prerequisites:
The following is the network configuration of Proxy and Storage node, Storage Node will have one network interface on the management network.
Install and configure swift proxy on the controller node:
Load your admin credential from the environment script.
# source admin-openrc.sh
Create the swift user for creating service credentials.
# openstack user create --password-prompt swift
User Password:
Repeat User Password:
+----------+----------------------------------+
| Field    | Value                            |
+----------+----------------------------------+
| email    | None                             |
| enabled  | True                             |
| id       | 023c019a62f3476d986627e8615b034f |
| name     | swift                            |
| username | swift                            |
+----------+----------------------------------+
Add the admin role to the swift user.
# openstack role add --project service --user swift admin
+-------+----------------------------------+
| Field | Value                            |
+-------+----------------------------------+
| id    | 33af4f957aa34cc79451c23bf014af6f |
| name  | admin                            |
+-------+----------------------------------+
Create the swift service entity.
# openstack service create --name swift --description "OpenStack Object Storage" object-store
+-------------+----------------------------------+
| Field       | Value                            |
+-------------+----------------------------------+
| description | OpenStack Object Storage         |
| enabled     | True                             |
| id          | b835a5fbfe3d4a9592f6dbd69ddb148d |
| name        | swift                            |
| type        | object-store                     |
+-------------+----------------------------------+
Modify the below settings and make sure to place an entries in the proper sections. Some time you may need to add sections if it does not exists and also you require to add some entries which are missing in the file, not all.
[DEFAULT]
...
bind_port = 8080
user = swift
swift_dir = /etc/swift

[pipeline:main]
pipeline = catch_errors gatekeeper healthcheck proxy-logging cache container_sync bulk ratelimit authtoken keystoneauth container-quotas account-quotas slo dlo proxy-logging proxy-server

[app:proxy-server]
...
account_autocreate = true

[filter:keystoneauth]
use = egg:swift#keystoneauth
...
operator_roles = admin,user

[filter:authtoken]
paste.filter_factory = keystonemiddleware.auth_token:filter_factory
...
auth_uri = http://controller:5000
auth_url = http://controller:35357
auth_plugin = password
project_domain_id = default
user_domain_id = default
project_name = service
username = swift
password = password
## Replace "password" with the password you chose for swift user in the identity service
delay_auth_decision = true
## Comment out or remove any other options in the [filter:authtoken] section

[filter:cache]
...
memcache_servers = 127.0.0.1:11211
That’s All!!!, in our next tutorial we will configure storage nodes.
VirtualizationComments Off on OpenStack Kilo on Ubuntu 14.04.2 – Configure Cinder #2
Sep072015
This is the second part of OpenStack Kilo on Ubuntu 14.04.2 – Configure Cinder, in this tutorial we will install and configure Storage Node for the Cinder service. For a demo purpose, will configure this storage node with a block storage device /dev/sdb that contains partition /dev/sdb1 occupying the entire disk.
Prerequisites:
The following is the network configuration of storage node, Storage Node will have one network interface on the management network.
Remove other ntp servers from the file, just hash out the lines that are starts with word “server”. Add below entry to get our nodes sync with controller node.
server controller
Restart the NTP service.
# service ntp restart
OpenStack packages:
Install the Ubuntu Cloud archive keyring and repository.
# pvcreate /dev/sdb1
Physical volume "/dev/sdb1" successfully created
Create the volume group vg_cinder.
# vgcreate vg_cinder /dev/sdb1
Volume group "vg_cinder" successfully created
Edit the /etc/lvm/lvm.conf file and add a filter that accepts the /dev/sdb device and rejects all other devices.
# nano /etc/lvm/lvm.conf
In the devices section, change
From
filter = [ "a/.*/ " ]
To
filter = [ "a/sdb/", "r/.*/" ]
Install and configure Cinder components:
Install the packages on the storage node.
# apt-get install cinder-volume python-mysqldb
Edit the /etc/cinder/cinder.conf file.
# nano /etc/cinder/cinder.conf
Modify the below settings and make sure to place an entries in the proper sections. Some time you may need to add sections if it does not exists and also you require to add some entries which are missing in the file, not all.
[DEFAULT]
...
rpc_backend = rabbit
auth_strategy = keystone
my_ip = 192.168.12.24
## Management IP of Storage Node
enabled_backends = lvm
glance_host = controller
verbose = True

[database]
connection = mysql://cinder:password@controller/cinder
## Replace "password" with the password you chose for cinder database

[oslo_messaging_rabbit]
rabbit_host = controller
rabbit_userid = openstack
rabbit_password = password
## Replace "password" with the password you chose for the openstack account in RabbitMQ.
[keystone_authtoken]
auth_uri = http://controller:5000
auth_url = http://controller:35357
auth_plugin = password
project_domain_id = default
user_domain_id = default
project_name = service
username = cinder
password = password
## Replace "password" with the password you chose for cinder user in the identity service
## Comment out or remove any other options in the [keystone_authtoken] section

[lvm]
volume_driver = cinder.volume.drivers.lvm.LVMVolumeDriver
volume_group = vg_cinder
iscsi_protocol = iscsi
iscsi_helper = tgtadm

## Replace vg_cinder with your volume group.

[oslo_concurrency]
lock_path = /var/lock/cinder

## Comment out the lock_path in (DEFAULT) section.
Restart the block storage service.
# service tgt restart
# service cinder-volume restart
Remove the SQLite database file.
# rm -f /var/lib/cinder/cinder.sqlite
Troubleshooting:
Go through the log for any errors.
# cat /var/log/cinder/cinder-volume.log
For errors like below.
"Unknown column 'volumes.instance_uuid' in 'field list'")"Unknown column 'volumes.attach_time' in 'field list"Unknown column 'volumes.mountpoint' in 'field list'""Unknown column 'volumes.attached_host' in 'field list'")
 phpPgAdmin is a web based administration tool for managing PostgreSQL database, it is very similar in look of phpMyAdmin. If you have a work experience on phpMyAdmin, you wont take much time in finding the way to work with. This guide will help you to setup phpPgAdmin on CentOS 7 / RHEL 7.
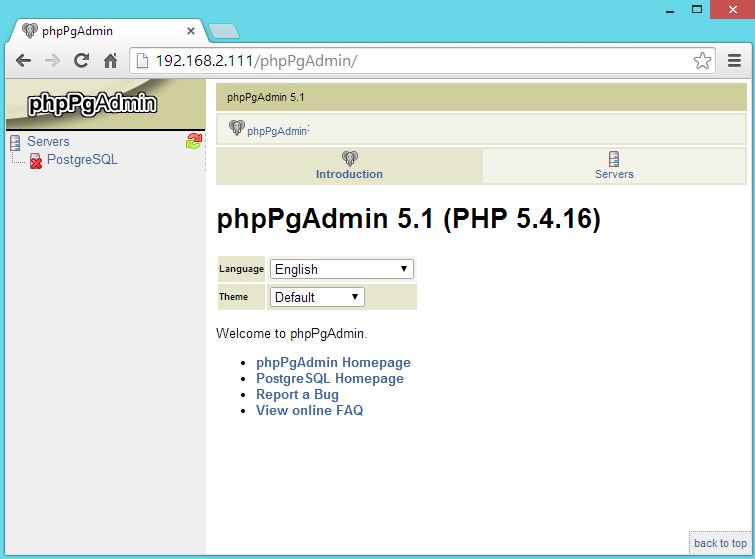
 OpenVAS known as Open Vulnerability Assessment System is the open source vulnerability suite to run the test against servers for known vulnerabilities using the database (Network Vulnerability Tests), OpenVAS is a free software, its components are licensed under GNU General Public License (GNU GPL). Here is the small guide to setup the